ENGLISH
|
BAHASA
Search
ABOUT MRC
Corporate Information
Clients' Charter
Board of Trustees
Management
Organisation Chart
RUBBER INDUSTRY
Industry Overview
Rubber Prices
PROGRAMMES
Commercialization Facilitation
E-Library
Glove Registration Exports
Hiring Solution Services
International Development Organisations
Scholarship Awards
Seminar and Training
Trade Shows
Working Visit and Specialised Mission
FUNDS / INCENTIVES
Commercialization Fund
Fund for Automation and Green Technology
Hiring Malaysian Workers Fund
Incentives
Industry Linkage Fund
EVENTS
Market Promotion
Seminar and Training
Domestic
MARKETPLACE
MEDIA
ANNUAL REPORT
DRY RUBBER FLIPBOOK
GLOBAL BRANDING CAMPAIGN
NEWS RELEASE
PROMOTIONAL MATERIAL
STRETCH
GUIDELINE/POLICY
SUSTAINABILITY
MEMBERS AREA
MRC Industry Overview
Rubber Industry
INDUSTRY
OVERVIEW
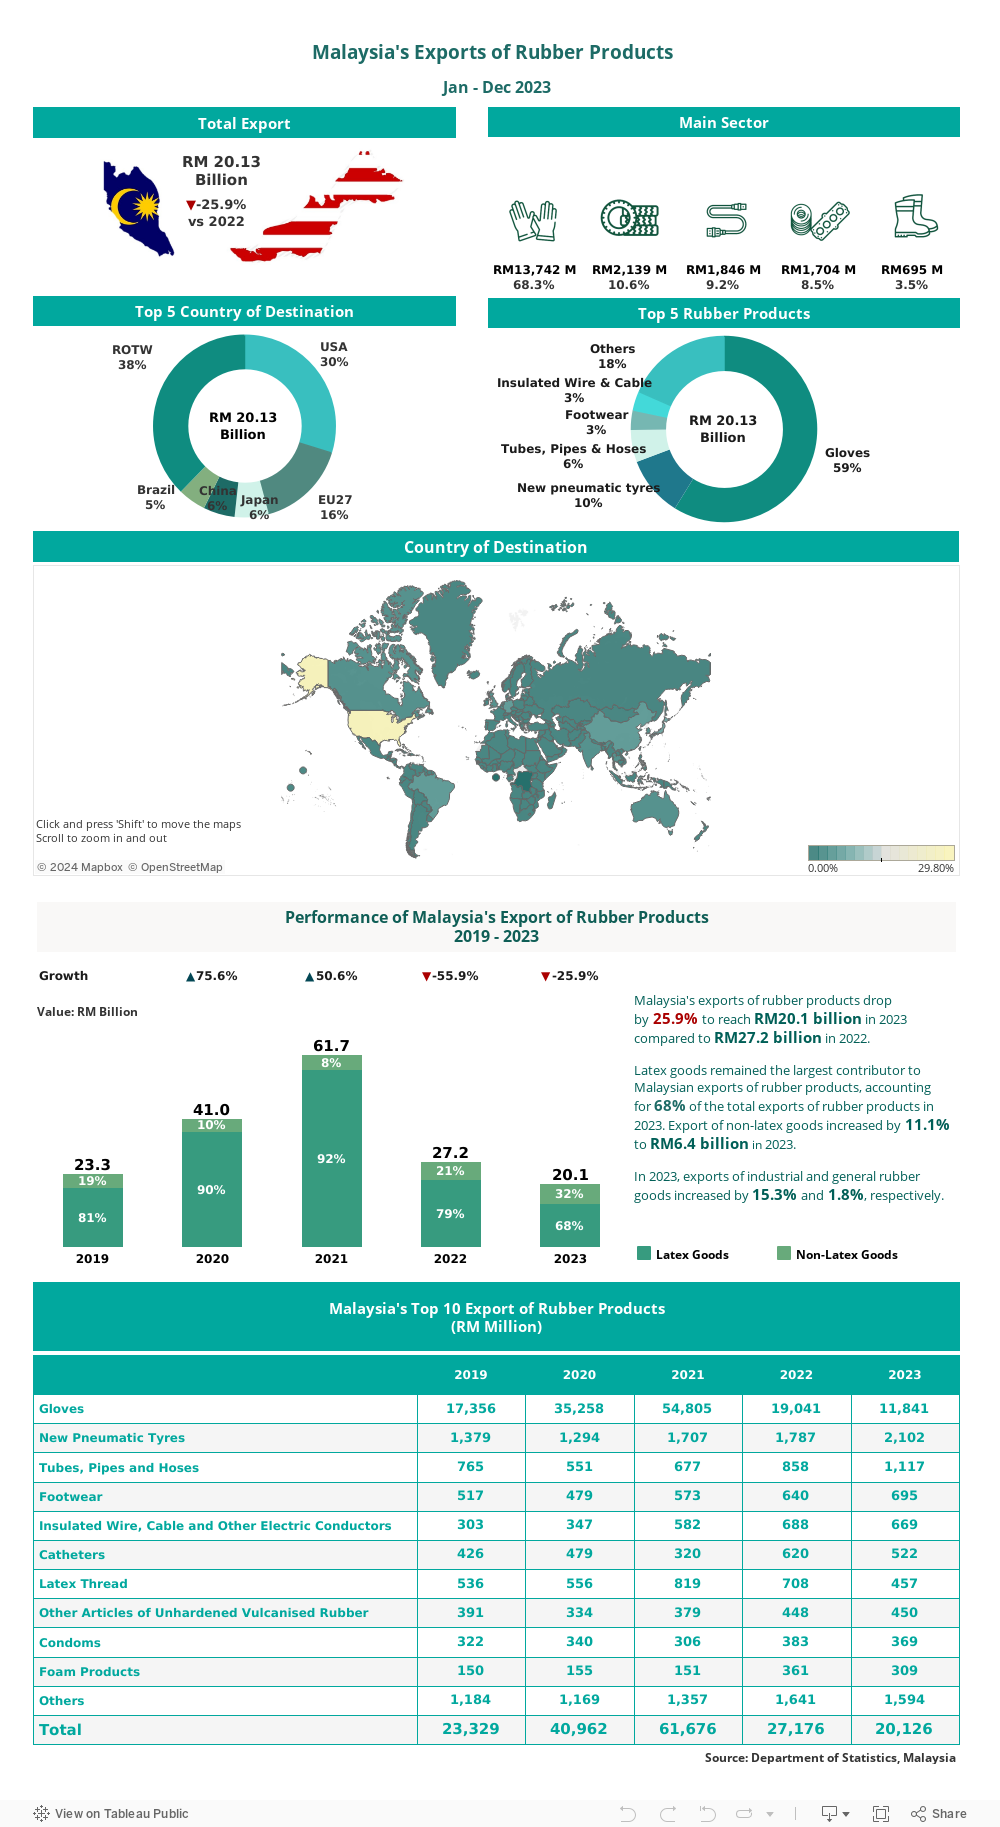
Malaysia's Exports of
Rubber Products
Malaysia's Imports of
Rubber Products
Malaysian Rubber Production,
Consumption and Trade
World Rubber Production,
Consumption and Trade
Chat with us
, powered by
LiveChat